Bij deze opgave horen de informatiebronnen 4 tot en met 6.

Adnane heeft te maken met de volgende financiële gebeurtenissen:
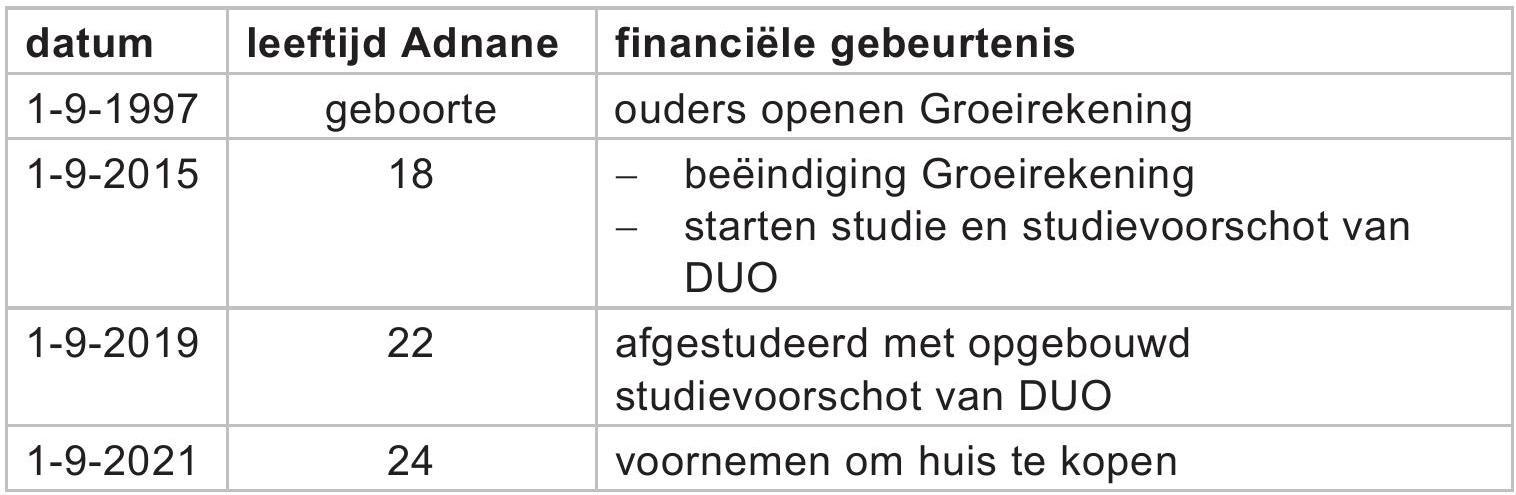

Bij deze opgave horen de informatiebronnen 4 tot en met 6.
Adnane heeft te maken met de volgende financiële gebeurtenissen:
Op deze pagina behandelen we vraag 25 van het centraal examen bedrijfseconomie havo 2022 – tijdvak 3. Deze vraag is onderdeel van Opgave 5, en is 3 punten waard.
Je kunt hier zelf het antwoord invullen en vervolgens direct de uitwerking en uitleg bekijken.
Daarnaast kun je:
De onderwerpen bij deze vraag zijn: